
Objective
This is the first part of the project named ” The Evaluation of NYC Green Infrastructure’s Performance in Mitigating Combined Sewer Overflow and Hudson River Pollution“. This research study aims to determine the effectiveness of GI under extreme events.
Background
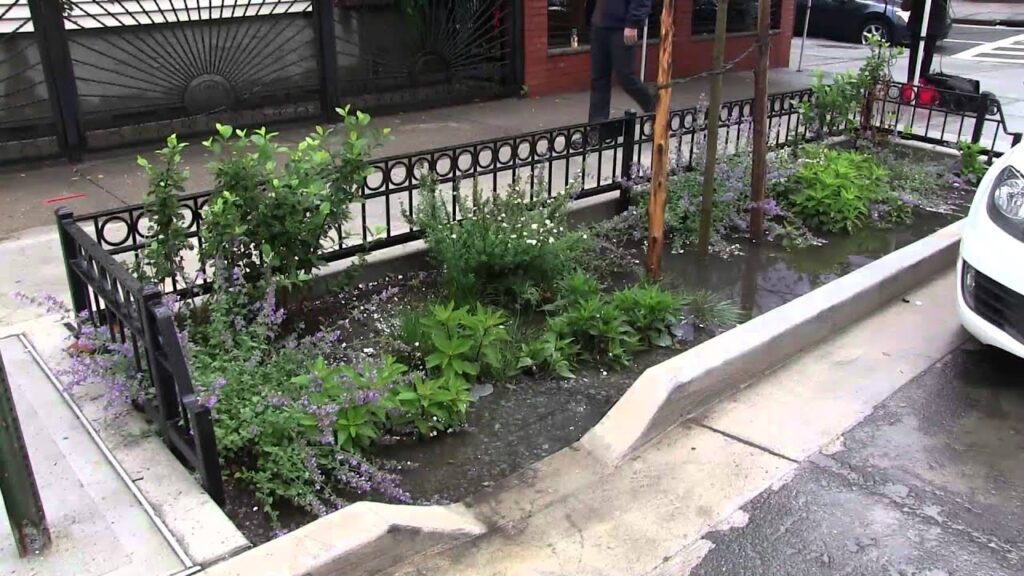
Image Credit : Bioswale / NYC Department of Environmental Protection
Green Infrastructure (GI) is typically used to control Combined Sewage Overflows (CSOs) in an urban setting. By capturing and infiltrating the rainwater, it prevents the pollution of waterways coming from CSOs. In 2010, NYCDEP budgeted about 2.4 billion to build GI.
Sewage overflow will happen if the rainfall event exceeds the sewer, catch basins, and GI capacity. The storm water and sewage will then flow into the waterways (e.g., the Hudson River) through CSOs without any water treatment, thus polluting the river. By analyzing the reduction in storm water runoff/ and CSOs due to GI, we will determine the potential effectiveness of it.
Methodology
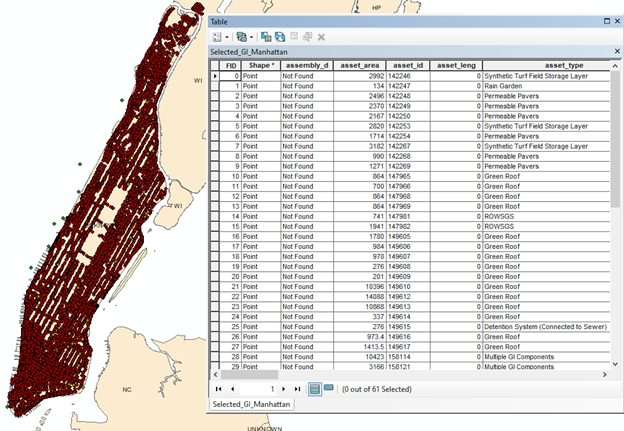
Green Infrastructures features and Catch Basin locations were obtained from NYCDEP and NYC Open Data. Initially, our focus area of this study is the Manhattan borough.
ArcGIS is used to geolocate and filter the GI and Catch Basins. With ArcMap 10.6, the point features of GI and Catch basin are selected within respective sewer sheds polygon and exported as a shapefile. The storm water runoff was statistically analyzed by using excess rainfall data to evaluate GI effectiveness. The Central Park station provides hourly precipitation data for Manhattan from 1949 to 2019. Extreme rainfall events in a short time can result in floods and cause the overflow to pollute NYC waterways. Therefore, we determine the variations of extreme rainfall events to compare as more surface runoff occurs during extreme rainfall events.
To develop the rate of runoff under different scenarios, the 99th quantile of all rainfall events and extreme rainfall yearly were obtained. A univariate extreme value distribution function is fit to the data and used to derive the 10 years design rainfall event. Further, we also performed uncertainty analysis for the hydrological return periods. 1000 samples of 10 years return period extreme rainfall events were generated to quantify the storm water runoff retained from Green Infrastructures in Manhattan. The following method was used to determine the developed flow rate and excess runoff by GI.
Rational Method (Peak runoff analysis)
The developed site flow was calculated using the rational method on the total site area, rainfall intensity, and average weighted runoff coefficient as per DEP’s Criteria (NYC DEP, 2012b). In this method, the weighted runoff coefficients are determined by the combination of the onsite surface coverage and each GI features. Therefore, the average weighted runoff coefficient of all GI features is calculated as follows.

where A is the total site area (ft2), k is the index for each onsite surface coverage type, is the area of each surface coverage type, is the runoff coefficient associated with each surface coverage type, is used directly in the calculation of developed site flow. The rate of runoff from the site is calculated as follows.

where I, is the rainfall inches/hourly or daily, is the weighted runoff coefficient, A is the total square footage of the site area and divided by 4360
as a conversion factor. Considering the uncertainty of imperviousness in Manhattan land cover, 21 variables of the weighted runoff coefficient were set to compute the excess runoff. Two different periods are separated to compute the developed flow rate for before and after GI to compare the effectiveness of GI. In before GI computation, we apply the sequence of
)weighted runoff coefficients of Manhattan land cover ranging from 0.68 to 0.86 and multiply by 3600
to compute the unit as ft3/hour in hourly analysis and 86400
as ft3/day in daily analysis.

The flow rate after Green Infrastructure was calculated by adding the runoff rate from all GI features in Manhattan and the runoff rate of area outside of GI computed by subtracting total area of GI from the Manhattan area.

To compare the runoff stimulation, we also computed the runoff using the NRCS approach which is proposed by the United States Department of Agriculture (USDA) for urban hydrology setting for small watersheds (Cronshey R,1986). NRCS method uses the curve number values in consistence with the runoff coefficients of NYC DEP to calculate excess runoff. NRCS method also yields the similar results for the developed flow rate. In this research, the whole process of the statistical analysis was done by using R Studio (3.6.1).
Results
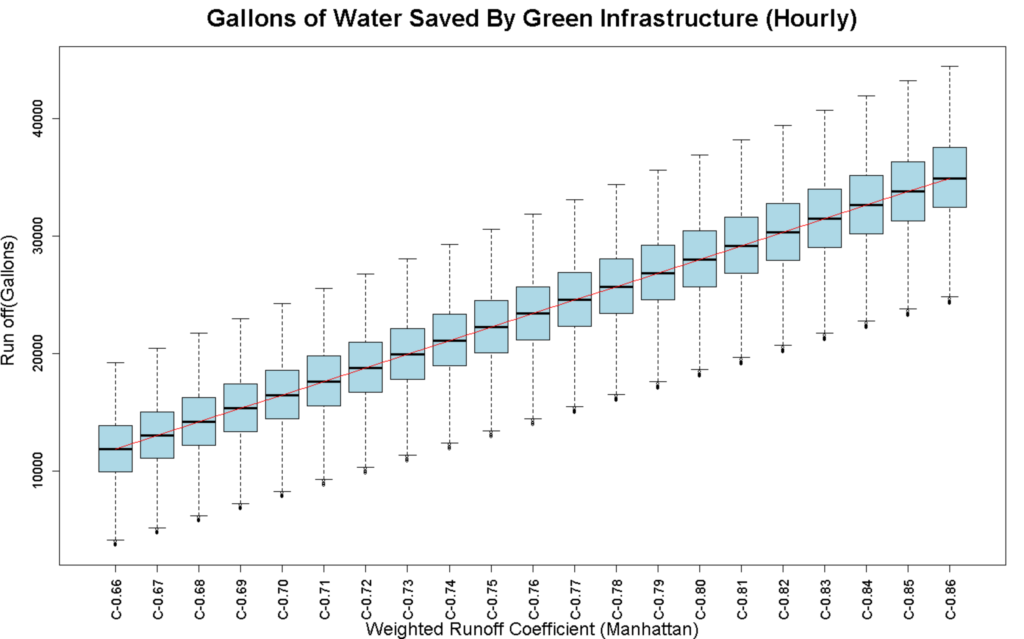
Figure 3 : Hourly extreme runoff values at different weighted runoff coefficient (0.66-0.86)
In the hourly analysis, extreme rainfall events range from 1.36 in/hour to 1.7 in/hour. After subtracting the flow rates before and after GI, we get the quantitative results of the gallons of water saved by green infrastructure. Figure (3) shows box plots increase linearly as C ranges from 0.66 to 0.86. The higher the C values are, the more runoff occurs. The range of water saved by GI increases from 10,000 gallons to 50,000 gallons.
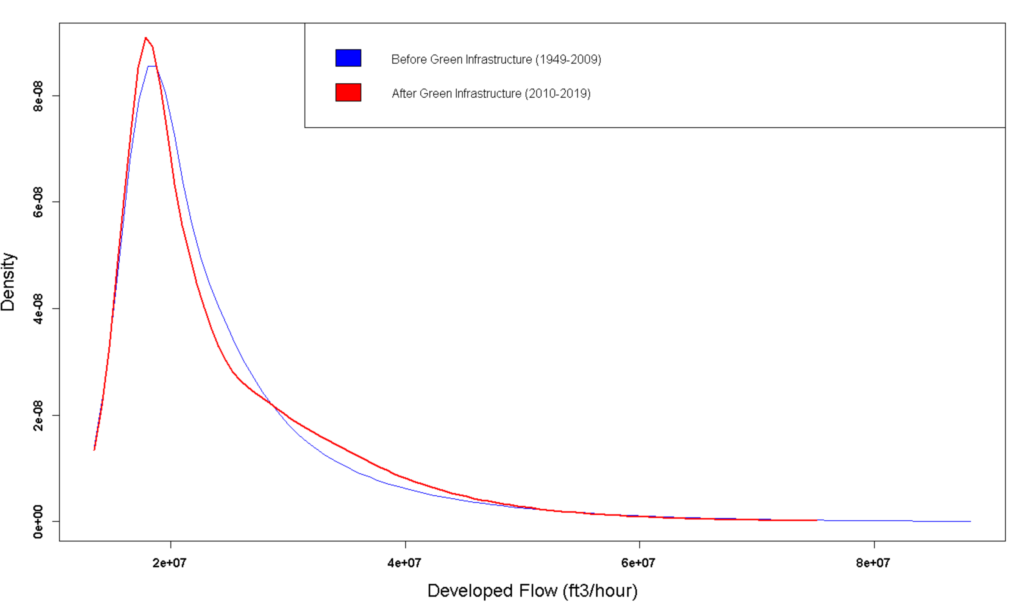
Figure 4: Comparison of Developed Flow Rate Before and After Green Infrastructure
Figure 4 presents the probability distribution of the before-GI and after-GI flow rate. We can find that the distribution shift to the left and the tail is less asymptotic compared to the before-GI case. The graph indicates that the flow rate went down substantially after green infrastructures were constructed from 2010 to 2019. There is a small reduction overall that shows the extreme runoff is controlled somewhat effectively by the green infrastructure.
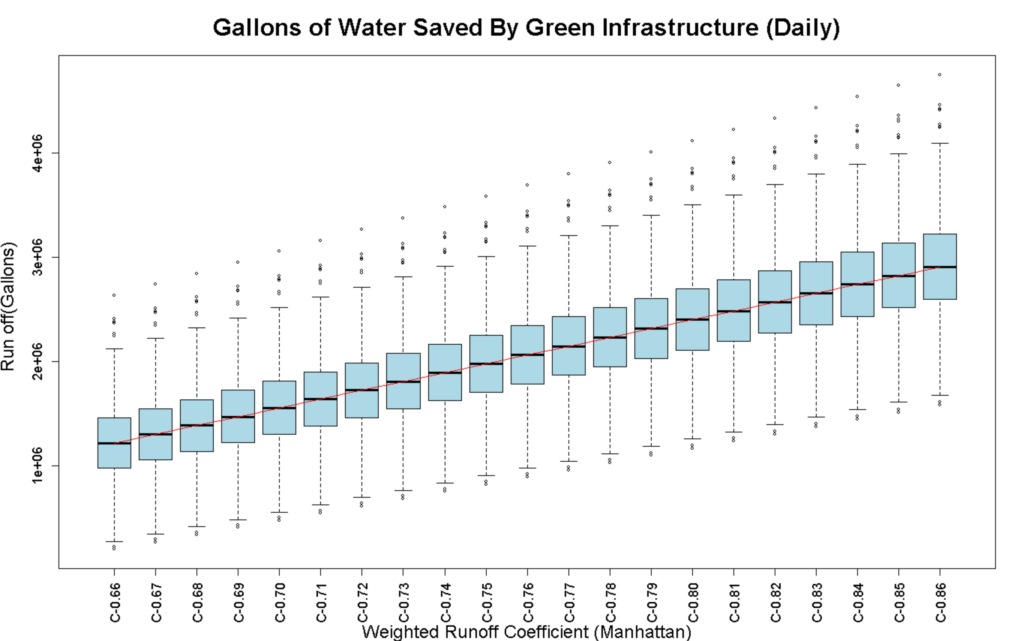
Figure 5: Daily extreme runoff values at different weighted runoff coefficient (0.66-0.86)
The extreme rainfall events range from 3.83 in/hour to 5.87 in/hour in the daily analysis. The rate of runoff increases as the accumulation of rainfall gets higher. In similarity to hourly analysis, figure (5) shows the median of flow rates per weighted runoff coefficient rising linearly. The occurrence of runoff is reflected by the average weighted runoff coefficients. The daily runoff rate increases from 1 million gallons to 4 million gallons. To provide a context, one can compare this to the total water usage in NYC of about 500 million gallons per day.
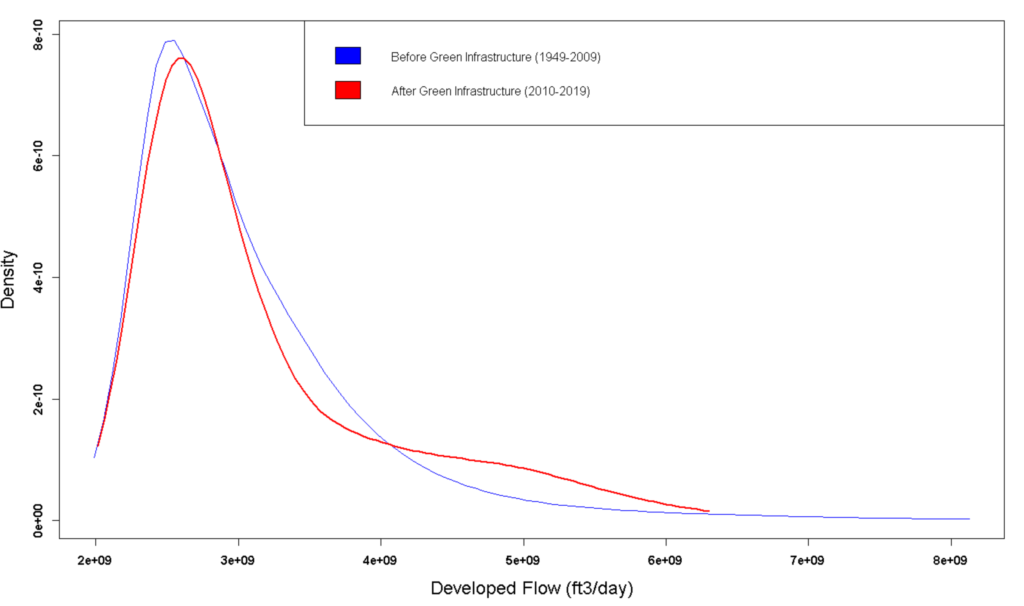
Figure 6: Comparison of Developed Flow Rate Before and After Green Infrastructure
From figure (6), we were able to see the runoff rates are not as extreme as before-GI has a longer tail than after-GI. GI is reducing the chance of producing extreme runoff.
Conclusion
In before and after green infrastructure simulation, the result indicates that GI is relatively effective in reducing the runoff rate. The first model presents the quantitative result of how much water is saved by the green infrastructures in Manhattan. The second model shows the comparison between the two different periods and the flow rates before and after GI was built. The result of this study provides the potential impact of implementing GI practices in New York City. Future work of this study can be carried out by creating a calculation model to analyze the retention of GI storage during hourly normal rainfall events and updating the GI data per DEP and NYC open data. The methodologies developed in this study can be applied to other boroughs of New York City to support the assessment of GI effectiveness.
The second part of the study will be presented by Liushen Wuchen. It will focus on the relationship between the runoff and water quality in the Hudson River.
Acknowledgement
This research was supported by CCNY ORCA (City College of New York: Opportunities in Research and Creative Arts) program. I wish to express my gratitude to our mentor Naresh Devineni from Department of Civil Engineering, CCNY, for his expert, patience guidance and supervision on completion of this project in its presently.
Reference
Cronshey R (1986) Urban hydrology for small watersheds. US Dept. of Agriculture, Soil Conservation Service, Engineering Division, Washington.
New York City Department of Environmental Protection (2012b) Guidelines for the design and construction of stormwater management systems. New York City Department of Environmental Protection/New York City Department of Buildings, New York.
Hamidi, A., Farnham, D.J. & Khanbilvardi, R. (2018) Uncertainty analysis of urban sewer system using spatial simulation of radar rainfall fields: New York City case study. Stoch Environ Res Risk Assess 32, 2293–2308

This entry is licensed under a Creative Commons Attribution-NonCommercial-ShareAlike 4.0 International license.